Human Development Index
From Wikipedia, the free encyclopedia.

The UN Human Development Index (HDI) is a comparative measure of poverty, literacy, education, life expectancy, and other factors for countries worldwide. It is a standard means of measuring well-being, especially child welfare. The index was developed in 1990 by the Pakistani economist Mahbub ul Haq, and has been used since 1993 by the United Nations Development Programme in its annual report.
The HDI measures the average achievements in a country in three basic dimensions of human development:
- A long and healthy life, as measured by life expectancy at birth.
- Knowledge, as measured by the adult literacy rate (with two-thirds weight) and the combined primary, secondary and tertiary gross enrollment ratio (with one-third weight).
- A decent standard of living, as measured by gross domestic product (GDP) per capita at purchasing power parity (PPP) in USD.
Each year, countries are listed and ranked according to these measures. Those high on the list often brag about it, as a means of attracting talented migrants (economically, individual capital) or discouraging potential emigrants from leaving.
Contents |
Method used to calculate the Human Development Index
The Human Development Index (HDI) represents the average of the following three indices:
- Life Expectancy Index =

- Education Index =
-
- Adult Literacy Index (ALI) =

- Adult Literacy Index (ALI) =
-
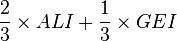
- Gross Enrolment Index (GEI) =

- Gross Enrolment Index (GEI) =
- GDP Index =

LE: Life expectancy
ALR: Adult literacy rate
CGER: Combined gross enrolment ratio
GDPpc: GDP per capita at PPP in USD
2005 report
The report for 2005 shows that, in general, the HDI for countries around the world is improving, with two major exceptions: the Post-Soviet states and the Sub-Saharan African states, both of which showed steady decline. HIV/AIDS is seen as the principal cause of the decline in the latter group, while worsening education, economies, and mortality rates caused declines in the HDIs amongst the former group.
Most of the data used for the 2005 report, indicating country HDIs for 2004, are derived largely from 2003 or earlier. The top ten countries are in Europe, North America, and Oceania. Thirty of the bottom 32 countries are in Africa. However, not all UN member states choose to or are able to provide the necessary statistics. Notable absences from the list include Afghanistan, Iraq, Liberia, North Korea, Serbia and Montenegro, and Somalia. While these countries are either unwilling or unable to provide data, they are generally considered countries of medium to low human development.
Note: Number in parentheses indicates change in rank since last report.
Top thirty countries
|
|
Bottom ten countries
|
Top/bottom three countries by continent
| Africa 51. |
Asia 11. |
Europe 1. |
| North America 5. |
Oceania 3. |
South America 34. |
Past top countries
The number one ranked country in each year of the index.
- 2004 – Norway
- 2003 – Norway
- 2002 – Norway
- 2001 – Norway
- 2000 – Canada
- 1999 – Canada
- 1998 – Canada
- 1997 – Canada
- 1996 – Canada
- 1995 – Norway
- 1994 – Canada
- 1993 – Japan
- 1992 – Canada
- 1991 – Japan
- 1990 – Canada
- 1985 – Canada
- 1980 – Switzerland
See also
- List of countries by Human Development Index
- United Nations
- Gini coefficient
- List of countries by income equality
- Physical quality-of-life index
- List of countries by GDP (PPP) per capita

